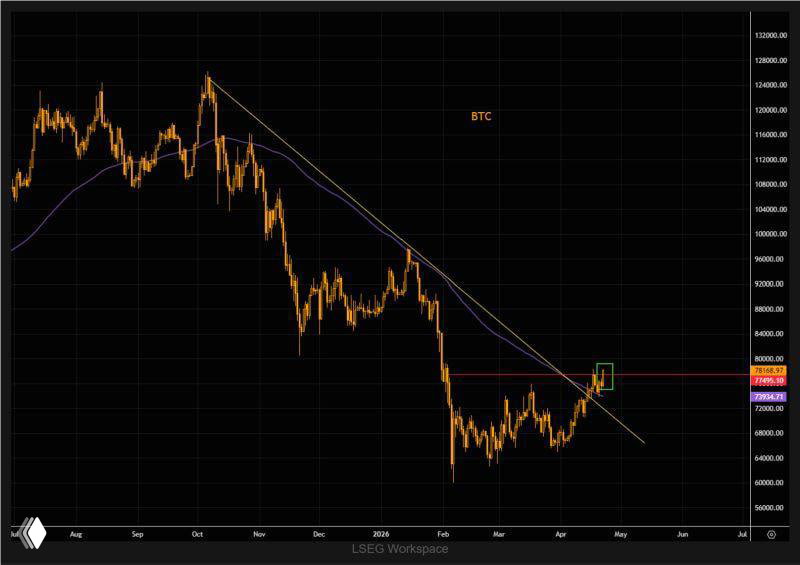
BTC is pushing higher — the long-standing downtrend line has been decisively breached, and price is now trading well above the 100-day moving average by a margin not seen in a long time.
This kind of technical shift often signals a regime change: from compression and apathy to expansion and momentum. When price extends this far above key trend levels, it typically reflects both improving spot demand and early positioning by faster money.
If BTC can hold and close here or higher, positioning looks increasingly fragile. A market that has been largely ignored can flip quickly — with underexposed investors forced to chase and shorts squeezed out.
The key dynamic now is reflexivity: higher prices attract flows, which push prices further, reinforcing the breakout. In that context, what starts as a technical move can evolve into a liquidity-driven rally — and that’s when things get very squeezy.