$4400 on gold: support must hold

We share clear, data-informed perspectives on global markets, commodities, and portfolio ideas—from market breadth and macro drivers to the future of real assets like tokenized gold. Our goal is to turn noisy headlines into actionable insight you can actually use. If you’re looking for concise explainers and thoughtful analysis, you’re in the right place.

gold4400200-day moving average

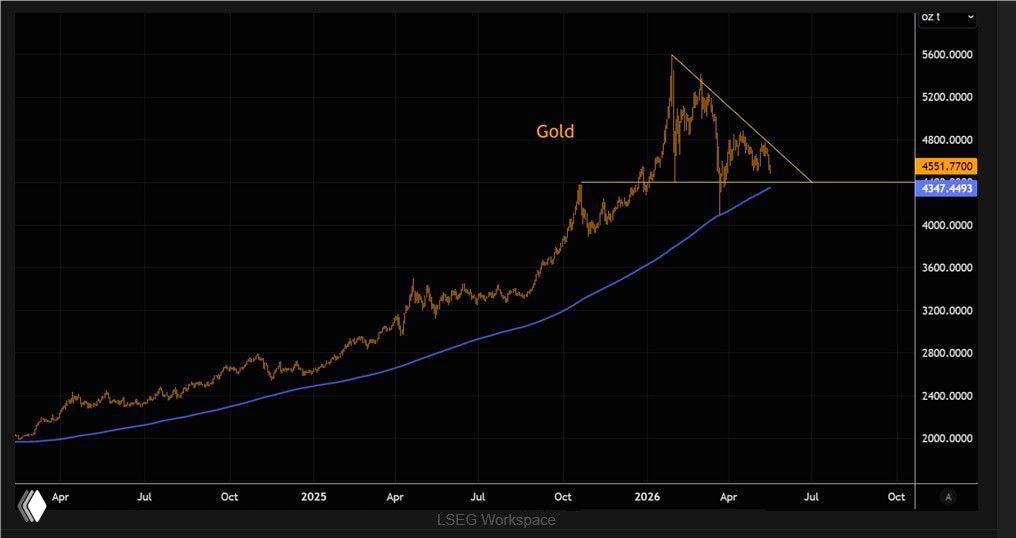
Gold has continued its huge consolidation phase following the violent pukes we saw earlier this year. The shorter-term trend line has survived several tests, but we are now approaching the major $4400 level, with the 200 day moving average coming in just below.

That is the must hold area.

Gold chart showing uptrend into a descending triangle, horizontal support near $4,400 and 200-day MA.
Gold price chart with 200-day moving average and $4,400 support level highlighted.

Read also